
Indicators [
 ]
]
The task of comparing measurement results is a good probe to gauge students' understanding of measurement uncertainties. These data comparison problems should not be reduced to a multiple choice in agreement/not in agreement question. Rather, this should be supported by a justification.
Structure of justification []
Looking at students' justifications in a data comparison problem, these usually consist of two components: a certain quantity that is compared, followed by the check of a certain criterion that is met (or not). Looking at the quantity and criterion that students mention in their justification, gives insight into students' conceptual understanding [1].
The following quantities have been identified for students comparing datasets:
- single measurements: students compare single, isolated measurements (e.g., a recurring value, an extreme value).
- uncertainty: students compare the uncertainty only.
- pairwise: students compare the results one pair at a time.
- mean value: students compare the mean value.
- deviations: students subtract two datasets and compare the resulting differences.
- complete dataset: students compare the dataset as a whole.
- uncertainty interval: students compare the whole uncertainty interval either as a range or as a mean ± uncertainty.
The following criteria have been identified:
- duplicates: students look for duplicate or recurring values.
- larger/smaller: students compare quantities and check whether one is larger or smaller than the other.
- counts: students count the occurrence of certain events e.g., one value being larger/smaller than the other.
- closeness: students look at how close or similar two datasets or measurement results are.
- overlap: students look for overlap (or the absence thereof) in their datasets or measurement results.
The combination of this compared quantity and checked criterion can be associated with the point and set paradigms, see Fig.10. If the combination is in a red area, the justification is associated with the point paradigm, if it lands in a green area, the justification can be associated with the set paradigm (for point and set paradigms see Point and Set).
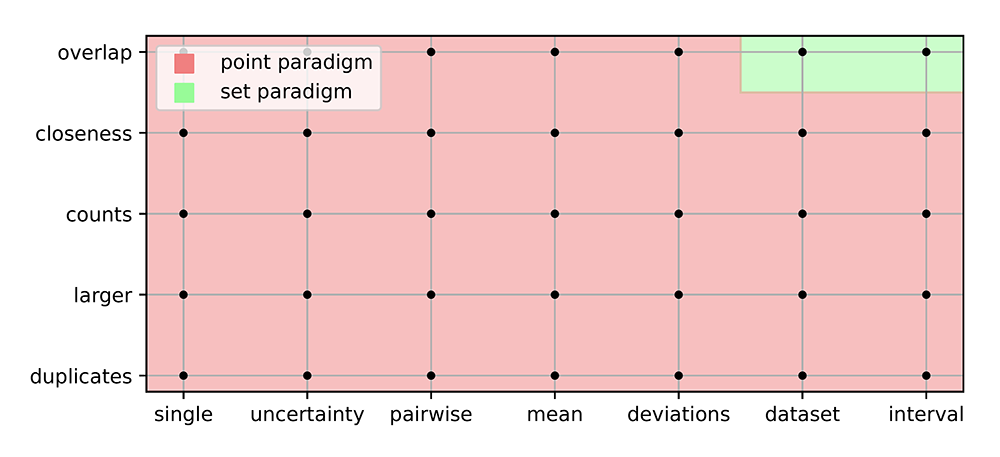
Figure 10: The combination of the quantity that is being compared and the criterion that is checked in a justification can be associated with the point and set paradigms.
Typical student responses []
Suppose two groups A and B measure the falling time of an object. The data is given in Tab. 7. Based on the data, students are asked whether the falling times are the same.
Table 7: Two datasets that can be compared for compatibility. The bottom row indicates the mean value.
| Falling times group A (s) | Falling times group B (s) |
| 1.530 | 1.548 |
| 1.573 | 1.534 |
| 1.522 | 1.520 |
| 1.548 | 1.571 |
| 1.583 | 1.523 |
| 1.538 | 1.526 |
| 1.549 | 1.537 |
One typical student response could be:
"The longest falling time 1.583 s occurs in group A. Therefore, the falling time of group A's object must be larger"
This person looks for the largest (larger/smaller criterion) value in the series (single value comparison) and concludes that the group to which this time belongs must have the longest falling time. This person has looked at a single value, and the criterion is that this is larger than other values in the series. This single measurement determines the conclusion of the experiment. This is strongly associated with the point paradigm in which single isolated values are representative of a whole series.
To support these learners, first, they could be asked to consider why a series of measurements is taken and what causes them to fluctuate. Thinking along these lines, learners should start to realize, that the sources for measurement uncertainties affect the results of both groups. Then these learners can be helped by letting them look at the spread of the whole series of measurements.
Another typical student response could be:
"The falling time of group A's object is longer because most of the time the falling time of group A is longer than that of group B."
This student has compared the measurements pairwise (pairwise comparison) one at a time and has looked at which of the two values is larger or smaller than the other (counts criterion). This is more sophisticated than the previous response since all values are considered. However, the isolated comparison of measurements, one at a time is also a clear example of point paradigm reasoning.
There are several strategies to help these students reflect their reasoning. One could re-arrange the measurements and ask the students what their conclusion is. Students will quickly realize that, with their current reasoning, their conclusion should change. Oftentimes, this is enough for students to recognize their flawed reasoning. Students should then be guided to look at the measurement series as a whole. One helpful strategy is to have them plot their results in a diagram. This will help them see the scatter of the dataset as a whole.
Another somewhat more sophisticated response could be:
"The two mean values, 1.549 s and 1.537 s are very close, and therefore the two times can be considered the same."
From this response, it becomes clear that this person has compared mean values (mean comparison) and that the criterion for agreement is that the values are close enough (closeness criterion). Although the comparison of the mean value could be considered set paradigm reasoning, students often do so as an automated routine. The mean value itself is then the only value that is considered, rendering it point paradigm reasoning. The closeness of the two values is also considered point paradigm reasoning. This is because, for the evaluation of this closeness to be relevant or not, the measurement uncertainty has to be considered.
To help these students, guiding questions could be considered. For instance to ask them about what they mean by "close", and how close is close enough for them. As long as the sum of the uncertainties is smaller than the difference between mean values, the results can still be considered incompatible.
Furthermore, it would be good to ask what role the mean value plays for the students. Is it, an estimation of centrality for the measurement series (set paradigm reasoning) or do students consider it "the final outcome" of the experiment (point paradigm reasoning)? If the latter is the case, one could follow up by asking what would happen to the mean value if another measurement were to be added to the series. A changing "true value" is troublesome from a point paradigm perspective, but a changing best estimation within the uncertainty interval is no issue from a set paradigm perspective.
Literature
- Kok, K., & Priemer, B. (2023). Assessment tool to understand how students justify their decisions in data comparison problems. Physical Review Physics Education Research, 19(2), 020141. https://doi.org/10.1103/PhysRevPhysEducRes.19.020141