
Comparing Multiple Results [ ]
]
There are cases where more than two datasets or measurement results are compared. Two cases are described here, comparing the results of more than two measurement results and analyzing the relation between two quantities by means of graphs (see also Graphs).
Comparing three measurement results [ ]
]
In Simple Comparison the process of comparing two datasets or measurement results was done. One can also use this same procedure to compare the results of three measurement results. However, one has to be very careful in interpreting the outcomes.
Suppose that the viscosity of three different liquids A, B, and C is measured, see Fig. 11. When comparing the viscosity of the liquids, one has to conclude that the viscosity of liquid A is compatible with C as well as with B. However, one cannot conclude that the result of liquid B is compatible with liquid C---although they are both compatible with liquid A.
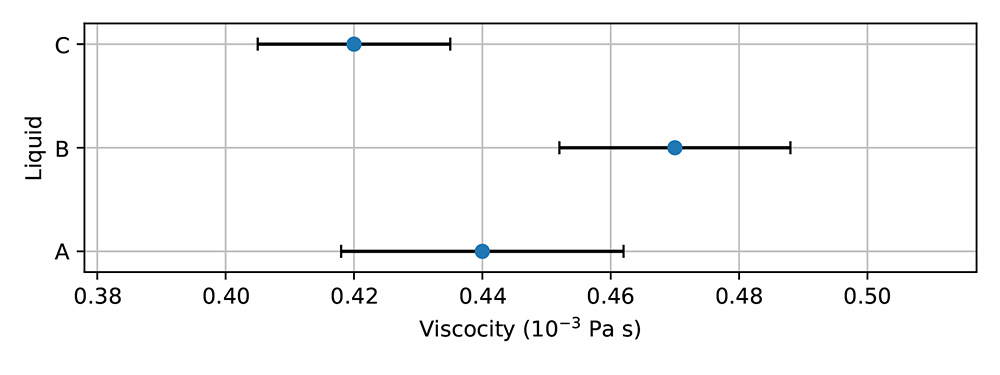
Figure 11: The measurement results for the viscosity of three liquids.
Moreover, based on the results, one has to conclude that liquid C has a lower viscosity than liquid B. For liquid A, the conclusion is limited to saying that its viscosity is compatible with that of both B and C. If one wants to make a more elaborate statement about the viscosity of liquid A, the uncertainties will have to be reduced.
Analyzing fit functions []
In cases where two quantities depend on one another, multiple measurements are taken. In the data analysis, one evaluates whether the two quantities fit a certain model or function. This data can be evaluated in tabular form, but students find it easier to interpret the results in graphical form [1, 2]. In Graphs the procedure for drawing fit functions and their uncertainties were described. This section looks into the interpretation of these fit functions.
To answer the question of whether heavier objects fall faster than lighter one could do an experiment. Figure 12a hows the data of the falling time of balls of different masses. The question now arises whether the mass influences the falling time or not.
At first glance, the data seems to be showing a decrease in falling time for increasing masses. This is also indicated by the fit function, see Fig. 12b. However, when looking at the maximum and minimum slope, see Fig. 12c, one can clearly see that both positive as well as negative slopes fit the data. The conclusion is that due to the possibility of positive and negative slopes, no influence of mass on the falling time can be assumed. Note that this conclusion could only be drawn after evaluation of the uncertainty.
If one aims to show the influence of friction on smaller masses, which would result in longer falling times for smaller masses, the uncertainties would have to be drastically reduced.
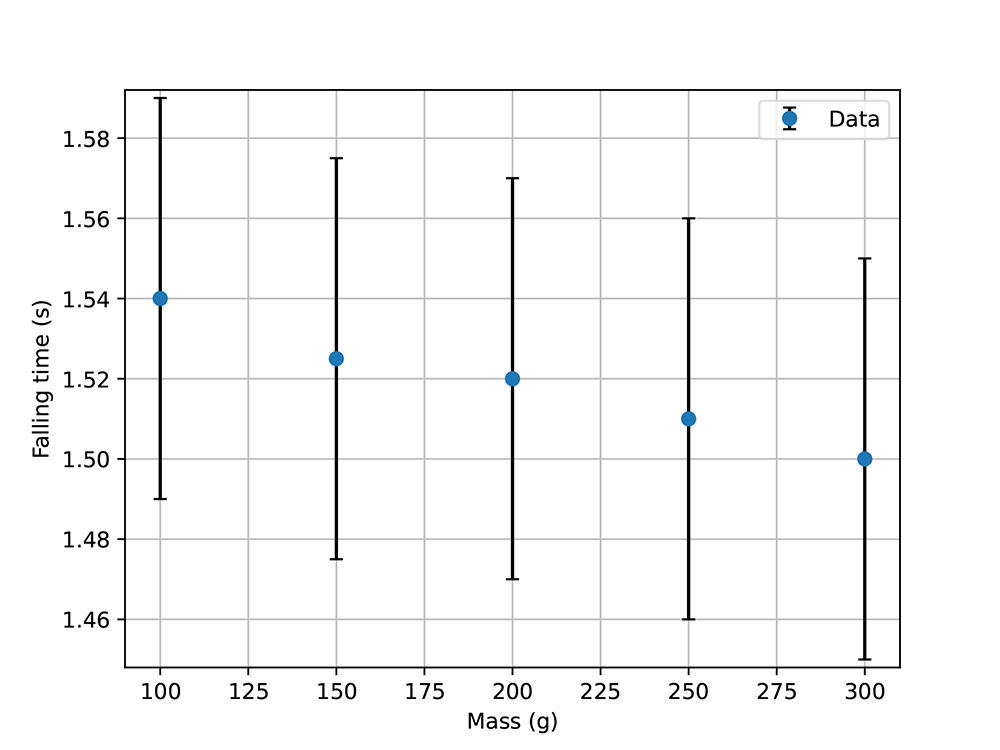
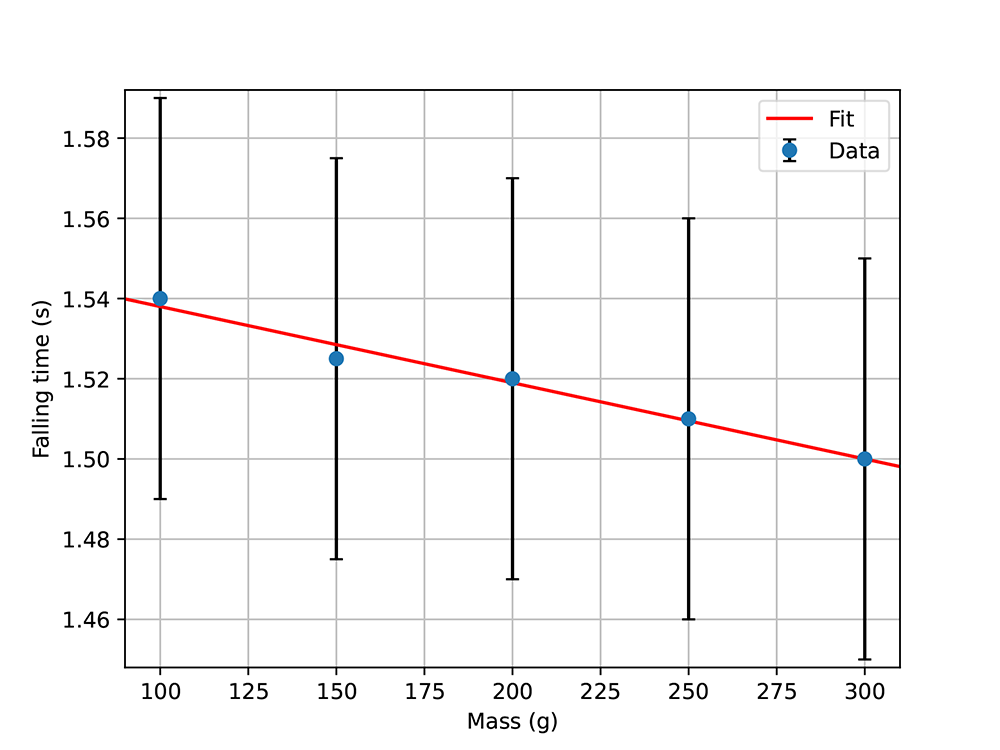
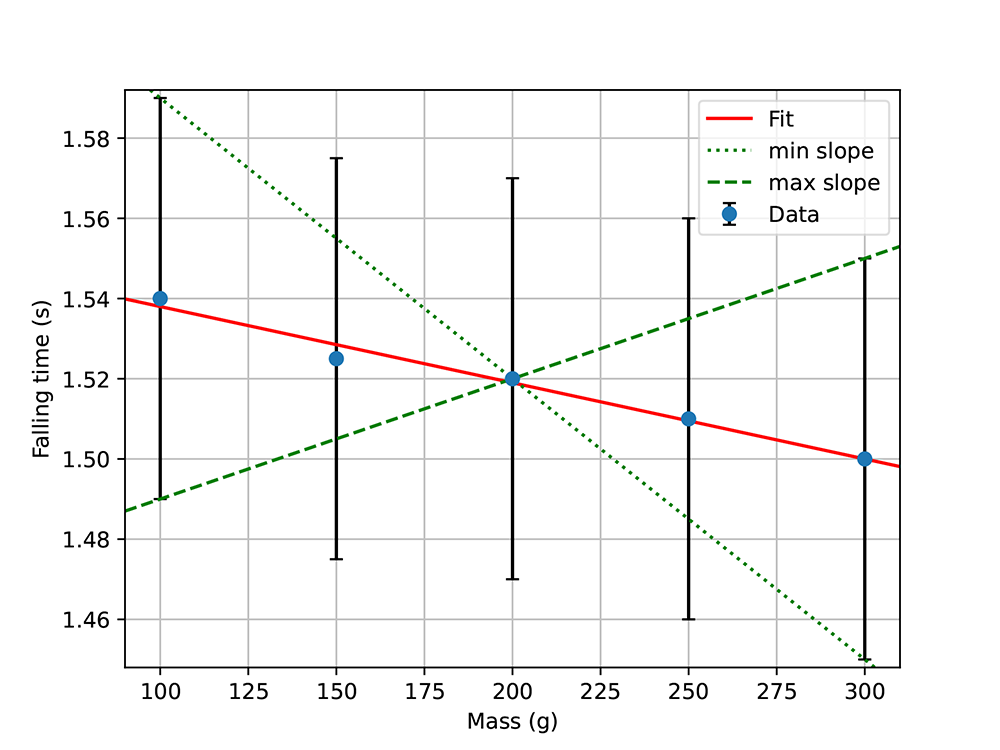
Figure 12: The results of an experiment in which balls of different masses are dropped from a certain height.
Suppose one is interested in the thermal expansion of water and wants to know the relation between the volume change and the temperature. To investigate this, one can perform an experiment in which the height of a column of water is measured for different temperatures, see Fig. 13a. The starting height is placed at 0 mm for a starting temperature of 10°C and the temperature is slowly increased in steps of 2°C to a temperature of 20°C, see Fig. 13b.
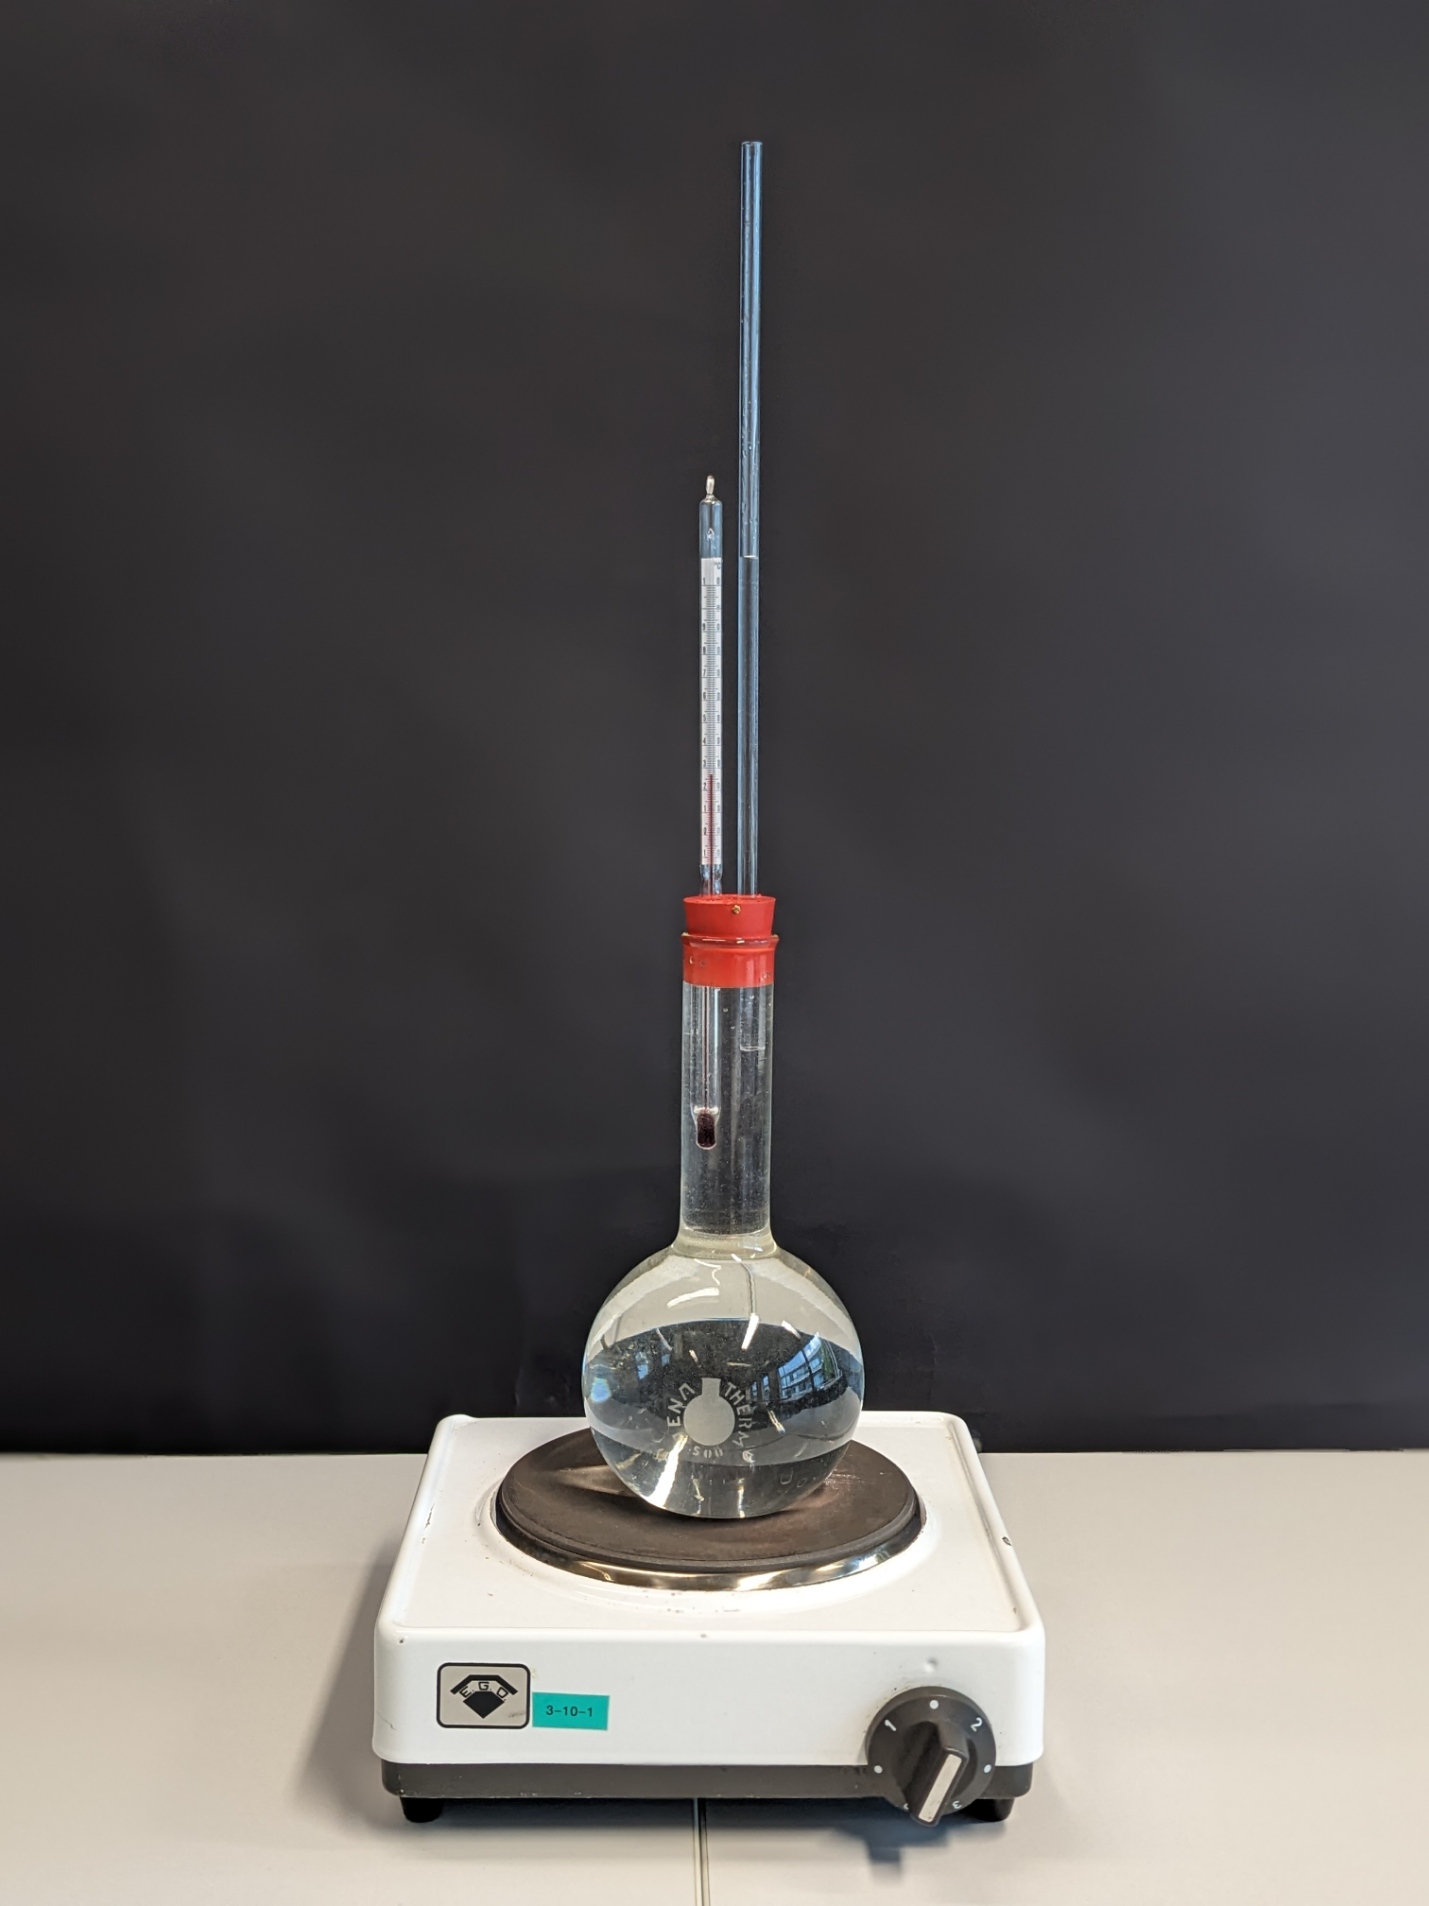
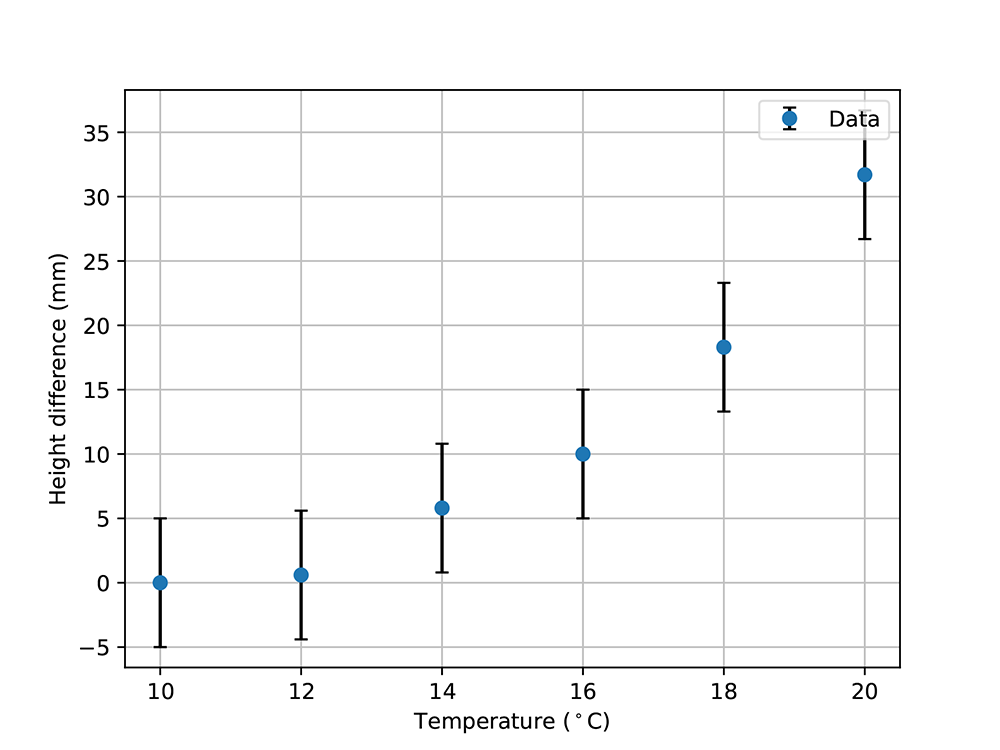
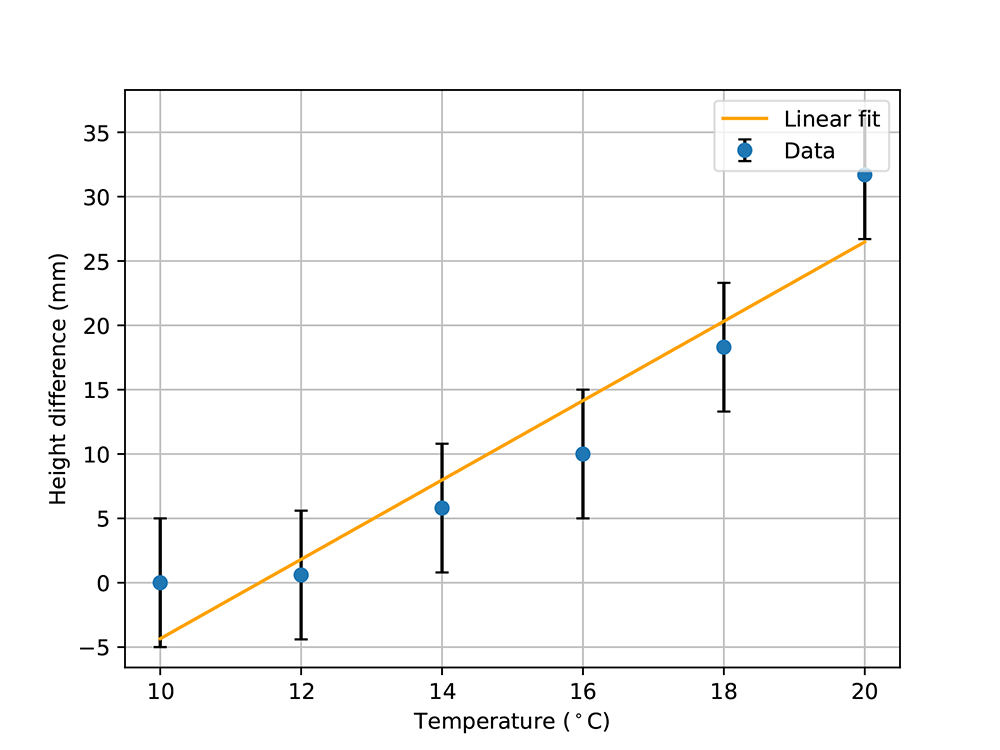
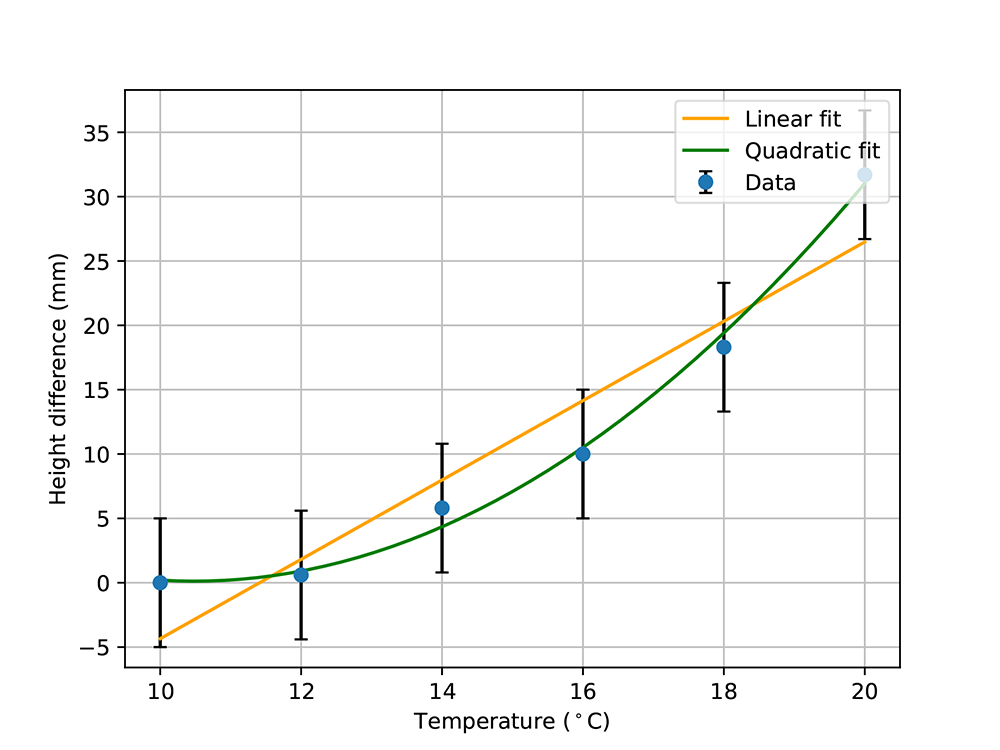

Figure 13: Some experimental data for the expansion of a volume of water for different temperatures.
As a first step, one starts to fit a linear fit function, see Fig.13c. This fit function goes through all uncertainty bars and, therefore, fits the data. Although a quadratic function fits the data better, see Fig. 13d, a linear dependence cannot be excluded. When refining the experiment and decreasing the uncertainties, see Fig. 13e, one is finally able to falsify a linear dependence and make a quadratic dependence more likely.
Further reading [ ]
]
A more detailed description and analysis of the thermal expansion of water is found here: [3].
Literature
- Kramer, R. S. S., Telfer, C. G. R., & Towler, A. (2017). Visual Comparison of Two Data Sets: Do People Use the Means and the Variability? Journal of Numerical Cognition, 3(1), 97–111. https://doi.org/10.5964/jnc.v3i1.100
- Susac, A., Bubic, A., Martinjak, P., Planinic, M., & Palmovic, M. (2017). Graphical representations of data improve student understanding of measurement and uncertainty: An eye-tracking study. Physical Review Physics Education Research, 13(2), 020125. https://doi.org/10.1103/PhysRevPhysEducRes.13.020125
- Wagner, S., Maut, C., & Priemer, B. (2021). Thermal expansion of water in the science lab—Advantages and disadvantages of different experimental setups. Physics Education, 56(3), 035022. https://doi.org/10.1088/1361-6552/abeac4