
Uncertainty [
 ]
]
The uncertainty of a measurement is a quantification of the variability of the measurements in an experiment. In most cases, the values of repeated measurements in an experiment follow the normal distribution. Therefore, it comes as no surprise that the standard deviation (or the standard deviation of the mean) is the most common scientific quantification of the uncertainty.
Of course, there are measurements in which no variability appears (for instance measuring the length of a table with a tape measure). Here, the uncertainty is determined by the measurement instrument, more on that in Type B.
Standard deviation of a distribution []
The standard deviation of a distribution is the scientific standard for describing the variability of a measured variable around its mean value. It can be calculated as: $$\sigma = \sqrt{\frac{1}{N}\sum_{i=1}^N(x_i-\bar{x})^2},\tag{2}$$ where N is the number of measurements, xi are the individual measurements, and x is the mean value.
When data are normally distributed, see Fig. 2, the area under the normal distribution between –σ and +σ covers 68% of the total area. This means that 68% of measurements will lie in the σ uncertainty interval (i.e., the range of values between x – σ and x + σ). For the 2σ-interval, this percentage increases to 95%.
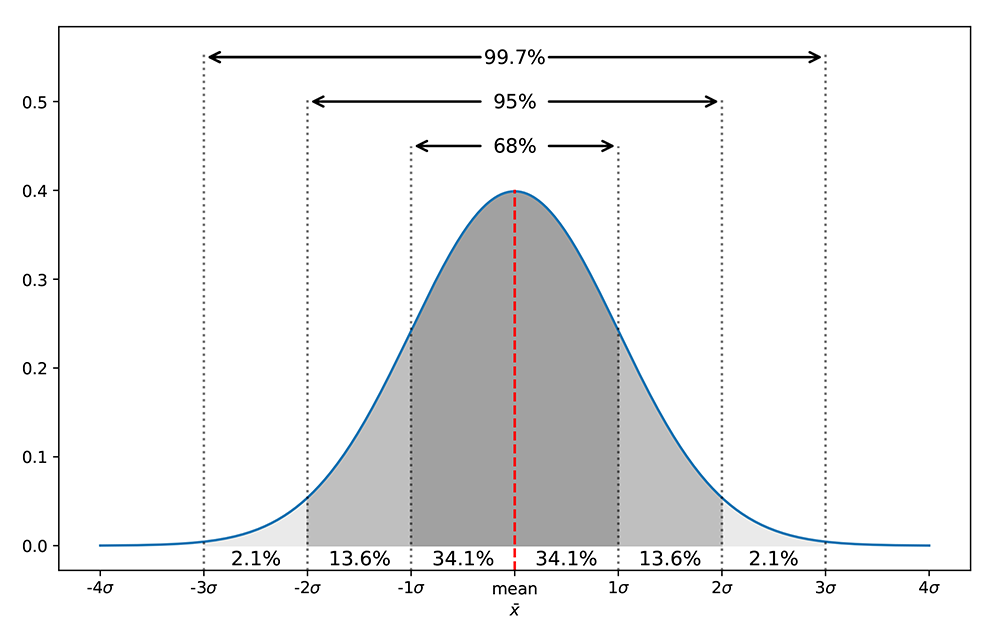
Figure 2: A normal distribution with a mean value at zero (red dashed line) and standard deviation σ. The dotted lines indicate the one, two, and three sigma boundaries. The percentages describe the how many measurements can be expected in the corresponding intervalls.
Looking back on the data of the falling distance of the ruler, see Fig. 3a, this data also has an uncertainty. Using equation (2) this uncertainty can be calculated, this is shown in Fig. 3b, the uncertainty interval is shown in Fig. 3c. Since the uncertainty interval includes 68% of the measurements, not all measurements lie within the uncertainty interval. Figure 3d also indicates the total range of values, which encompasses all measurements.
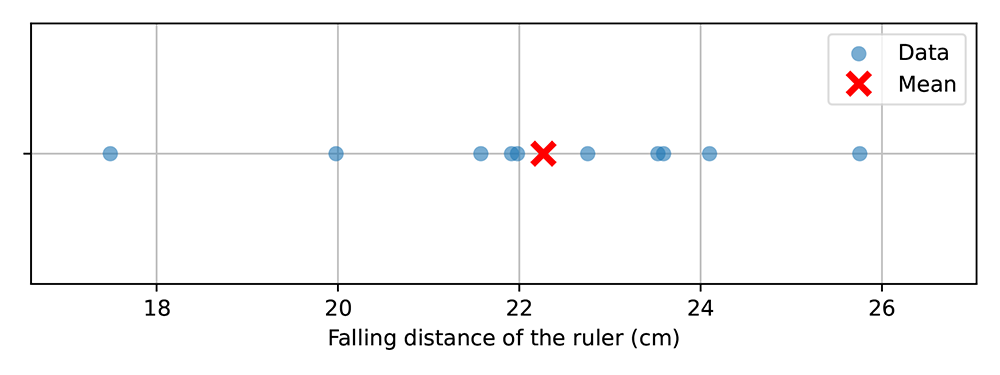
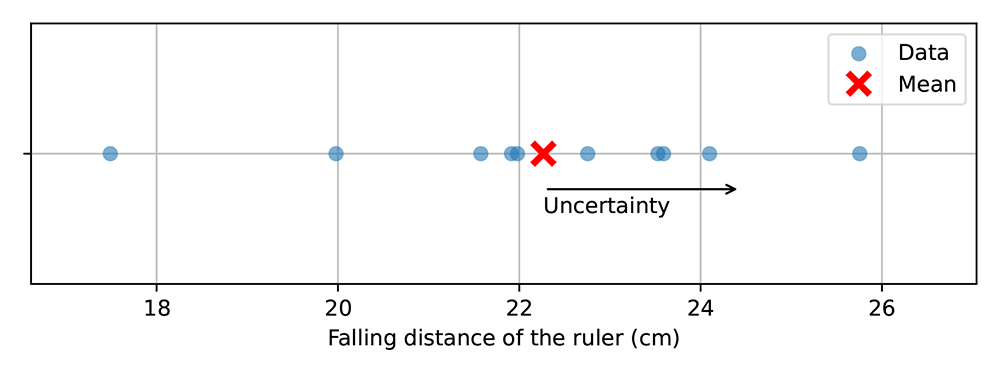
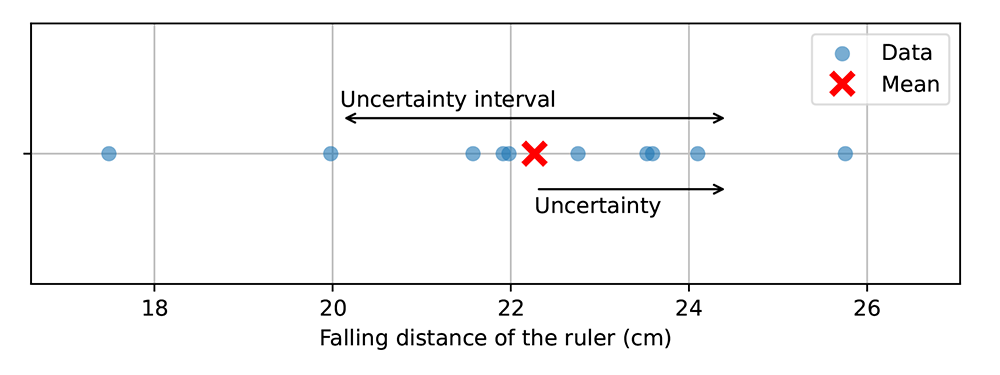
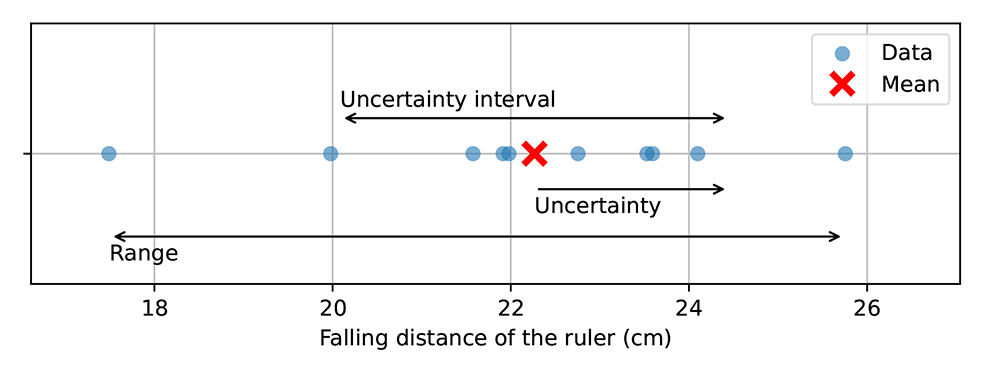
Figure 3: Measurement data of the falling distance of a ruler, now with the uncertainty.
Standard deviation of the mean [ ]
]
The standard deviation of the mean, as the name suggests, gives the uncertainty of the mean value (rather than the uncertainty of the individual measurements). $$\sigma_{\bar{x}} = \frac{\sigma}{\sqrt{N}}.\tag{3}$$
The standard deviation of the mean is sometimes called the standard error. Due to the negative co-notation of the word error, the use of the term standard deviation of the mean is preferred.
In contrast to the standard deviation, the standard deviation of the mean becomes smaller with an increasing number of measurements. Conceptually, this can be understood because the increasing number of measurements, although they might have large uncertainties, starts to show the underlying distribution more and more clearly. From this distribution, the center (the mean value) can be determined with more certainty.
Students' ideas about the uncertainty []
Many students will see the uncertainty as something that can be eliminated in an experiment [1–3]. This heavily ties in with the belief in the existence of a ⓘ "true value"true value: Hypothetical construct that would portray an exact true result., see True Value. Some students believe that, given enough practice, the uncertainty can be reduced to zero, others believe that this can only be done given "real" measurement instruments, again others think this can only be done by "professional" scientists. However, uncertainties will always show up in every experiment. They are omnipresent in every experiment and are unequal to zero.
Some students and even textbooks refer to measurement uncertainties as "errors". It is known that the use of this word misleads students into thinking that they have done something wrong [3–8]. Also, the Guide to the Uncertainty of Measurements (short GUM [9]) explicitly refrains from using the term "error". The word "error", in the context of measurement uncertainties, represents an actual error: a (non-fixable) mistake or something that has gone wrong. Measurement uncertainties, on the other hand, are a part of every scientific experiment and cannot be avoided.
The omnipresence of measurement uncertainties and the notion that all scientists have to deal with this—and the resulting uncertainty—can be a comforting thought for students. It shows them that they are not doing something wrong, but rather engage in authentic scientific practice. This simultaneously develops their view on the nature of science [10–12].
Although the standard deviation might be too complex or time-consuming in secondary education (alternatives will be discussed later in Type A). One common misconception is worth mentioning:
This is the belief that more measurements will lead to a smaller standard deviation [13]. However, this is not the case. More measurements (xi) will not lead to a smaller value of the standard deviation (σ), see equation (2). Rather, with more measurements one gets a better description of the distribution of the measurements, i.e., the shape of the normal distribution becomes more smooth. But the width of this shape does not change. However, the standard deviation of the mean (σ x) does become smaller. But this quantification is not always known to students or they cannot conceptually distinguish between the two.
Literature
- Coelho, S. M., & Séré, M. (1998). Pupils' Reasoning and Practice during Hands‐on Activities in the Measurement Phase. Research in Science & Technological Education, 16(1), 79–96. https://doi.org/10.1080/0263514980160107
- Munier, V., Merle, H., & Brehelin, D. (2013). Teaching Scientific Measurement and Uncertainty in Elementary School. International Journal of Science Education, 35(16), 2752–2783. https://doi.org/10.1080/09500693.2011.640360
- Pillay, S., Buffler, A., Lubben, F., & Allie, S. (2008). Effectiveness of a GUM-compliant course for teaching measurement in the introductory physics laboratory. European Journal of Physics, 29(3), 647–659. https://doi.org/10.1088/0143-0807/29/3/024
- Goedhart, M. J., & Verdonk, A. H. (1991). The development of statistical concepts in a design-oriented laboratory course in scientific measuring. Journal of Chemical Education, 68(12), 1005–1009. https://doi.org/10.1021/ed068p1005
- Heinicke, S. (2012). Aus Fehlern Wird Man Klug: Eine Genetisch-Didaktische Rekonstruktion des Messfehlers. Logos Verlag Berlin GmbH.
- Kampourakis, K., & McCain, K. (2019). Uncertainty: How It Makes Science Advance. Oxford University Press. https://www.oxfordscholarship.com/view/10.1093/oso/9780190871666.001.0001/oso-9780190871666
- Kirkup, L. (2002). A guide to GUM. European Journal of Physics, 23(5), 483–487. https://doi.org/10.1088/0143-0807/23/5/305
- Rollnick, M., Dlamini, B., Lotz, S., & Lubben, F. (2001). Views of South African Chemistry Students in University Bridging Programs on the Reliability of Experimental Data. Research in Science Education, 31(4), 553–573. https://doi.org/10.1023/A:1013102108541
- Joint Committee for Guides in Metrology. (2008). Evaluation of measurement – guide to the expression of uncertainty in measurement (JCGM 100:2008). JCGM. https://www.bipm.org/utils/common/documents/jcgm/JCGM_100_2008_E.pdf
- Heinicke, S., Glomski, J., Priemer, B., & Rieß, F. (2010). Aus Fehlern wird man klug—Über die Relevanz eines adäquaten Verständnisses von "Messfehlern" im Physikunterricht. Praxis der Naturwissenschaften – Physik in der Schule, 59(5), 5–15.
- Lederman, N. G. (2007). Nature of Science: Past, Present, and Future. In S. K. Abell, K. Appleton, & D. Hanuscin (Eds.), Handbook of Research on Science Education (pp. 831–879). Routledge. https://www.taylorfrancis.com/books/edit/10.4324/9780203824696/handbook-research-science-education-sandra-abell-ken-appleton-deborah-hanuscin?refId=36e26214-2e84-406f-9bd7-215ddc71f456&context=ubx
- Priemer, B., & Lederman, N. G. (2021). Nature of Scientific Knowledge and Nature of Scientific Inquiry in Physics Lessons. In H. E. Fischer & R. Girwidz (Eds.), Physics Education (pp. 113–150). Springer International Publishing. https://doi.org/10.1007/978-3-030-87391-2_5
- Séré, M., Journeaux, R., & Larcher, C. (1993). Learning the statistical analysis of measurement errors. International Journal of Science Education, 15(4), 427–438. https://doi.org/10.1080/0950069930150406