
Mean Value [
 ]
]
The arithmetic mean value of a series of measurements can be calculated as: $$\bar{x} = \frac{1}{N}\sum_{i=1}^N x_i, \tag{1}$$ where N is the number of repeated measurements and xi are the individual measurements.
The mean value is considered the best estimation of the value of the measurand from a series of measurements—the most central value of the series. One can also think of it like this: if one had to guess what the next measurement would be, the mean value will—on average—be closest to this new measurement.
This coincides with the idea that one can stop measuring when the mean value (and the uncertainty) have stabilized. At that point, the mean value coincides with the most central value of measurements that the experiment produces.
The arithmetic mean is most often used as the best estimation of the measurand. However, there are alternative quantifications. One possibility is to use the ⓘ medianmedian: The middle value in a series of sorted measurements.: the middle value of a sorted dataset. Another measure is the ⓘ modusmodus: The most often occuring value in a series of measurements.: that measurement that most often occurs. Lastly, in the case when repeated measurements all give the exact same result, the best estimation is just that one value.
Suppose, one wants to measure the reaction time of a student. This can be done by measuring the falling distance of a ruler, see Fig. 1a. Using the equation h = 1/2 g t2 one can determine the reaction time. The measured data is shown graphically in Fig. 1b. The most central point of these measurements is the mean value, which is indicated in Fig. 1c as a red cross.
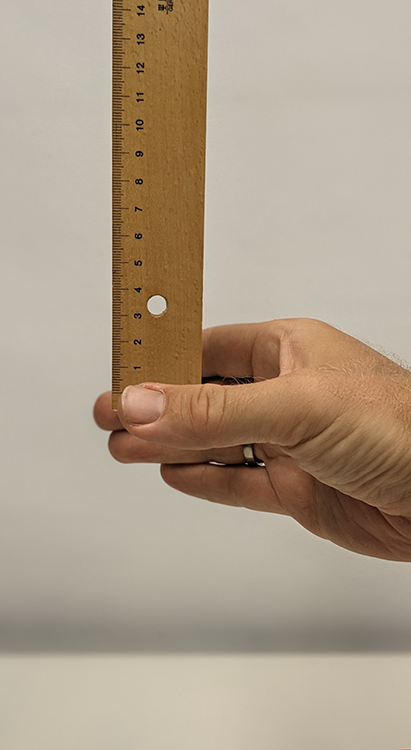
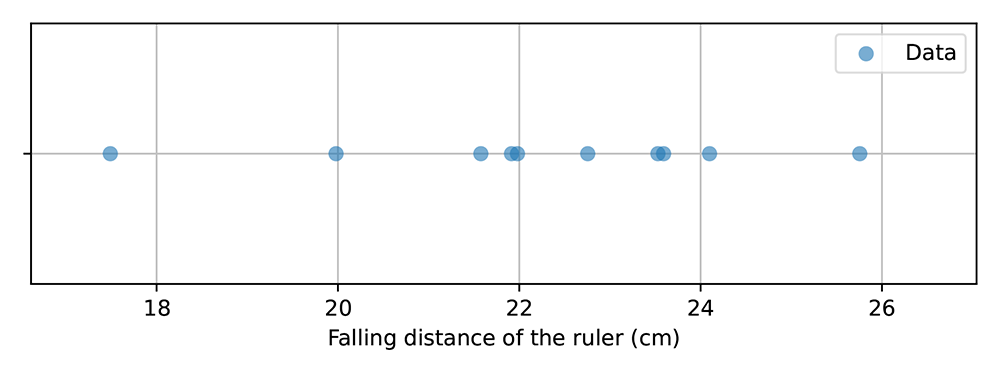
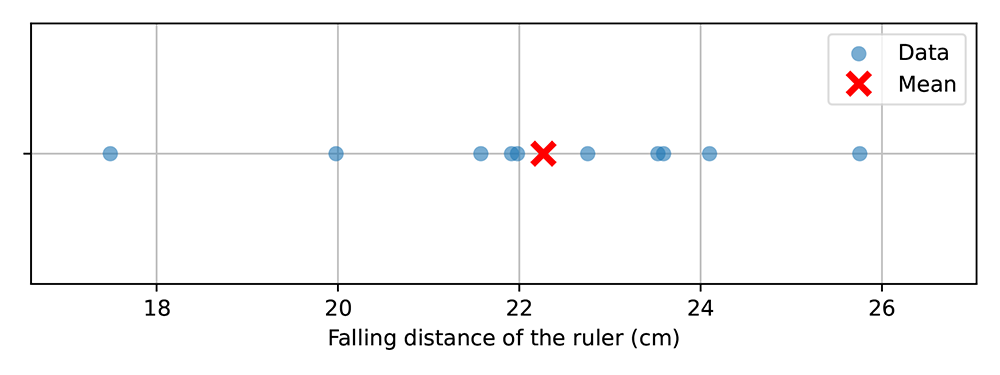
Figure 1: Measurement data of an experiment in which the reaction time is determined by measuring the falling distance of a ruler.
Students' ideas about the mean value []
Calculating the mean value usually does not pose a problem for students. However, students' reasoning about what the mean value represents often remains superficial [1, 2].
Sometimes the mean value is mentioned as a reason for gathering repeated measurements. Although, of course, one has to collect multiple measurements to calculate a mean value [3], this is often a routine and automated procedure and the mean value is regarded as an isolated value. Some students go even further and will regard this value as a ⓘ "true vale"true value: Hypothetical construct that would portray an exact true result. [4]. Although the process of calculating a mean value from a series of repeated measurements can be associated with the set paradigm, regarding the mean value as an isolated value is considered point paradigm thinking [5]. To move to an adequate set paradigm reasoning, students need to supplement it with the uncertainty.
Another idea about the mean value that exists, is that it is "more precise" [6]. Although a (stabilized) mean value is the best estimation of the value of the measurand, this does not say something about precision—which is indicated by the uncertainty.
Literature
- Majiet, N., & Allie, S. (2019, January 21). Student understanding of measurement and uncertainty: Probing the mean. 2018 Physics Education Research Conference Proceedings. 2018 Physics Education Research Conference, Washington, DC. https://doi.org/10.1119/perc.2018.pr.Majiet
- Kampen, P. van, & Gkioka, O. (2021). Undergraduate students' reasoning about the quality of experimental measurements of covarying secondary data. European Journal of Physics, 42(4), 045704. https://doi.org/10.1088/1361-6404/abfd27
- Allie, S., Buffler, A., Lubben, F., & Campbell, B. (2002). Point and Set Paradigms in Students' Handling of Experimental Measurements. In H. Behrendt, H. Dahncke, R. Duit, W. Gräber, M. Komorek, A. Kross, & P. Reiska (Eds.), Research in Science Education—Past, Present, and Future (pp. 331–336). Kluwer Academic Publishers. https://doi.org/10.1007/0-306-47639-8_47
- Ford, M. J. (2005). The Game, the Pieces, and the Players: Generative Resources From Two Instructional Portrayals of Experimentation. Journal of the Learning Sciences, 14(4), 449–487. https://doi.org/10.1207/s15327809jls1404_1
- Buffler, A., Allie, S., & Lubben, F. (2001). The development of first year physics students' ideas about measurement in terms of point and set paradigms. International Journal of Science Education, 23(11), 1137–1156. https://doi.org/10.1080/09500690110039567
- Coelho, S. M., & Séré, M. (1998). Pupils' Reasoning and Practice during Hands‐on Activities in the Measurement Phase. Research in Science & Technological Education, 16(1), 79–96. https://doi.org/10.1080/0263514980160107