
Data Comparison [
 ]
]
Thus far, the focus has been on the sources of measurement uncertainties, how they affect the data, how they can be quantified, and how they can be propagated. This part will be concerned with using the measurement uncertainty.
Measurement uncertainties are not just a burden to be calculated at the end of an experiment---that is, they should not be! Measurement uncertainties are useful because they allow one to compare measurement results. Only by coincidence, two mean values of two datasets are exactly the same. This, however, does not mean that two results are only then compatible with one another. For a correct comparison, the uncertainty intervals have to be compared.
This section is concerned with some practical rules for comparing measurement results in general and how students reason in these comparisons.
Simple Comparison []
Comparing two measurement results is a common practice in science. This comparison cannot be done without taking the measurement uncertainty into account.
One way to compare two mean values in science is by calculating a t-test. The mathematical procedure of how this test is calculated and how the significance of this test is determined is beyond the scope of this unit or the high school level. But what the test ultimately does is to compare the two mean values, take their respective variance as well as the number of repeated measurements into account, and determine the degree of overlap between them.
Comparing uncertainty intervals []
To compare datasets or measurement results in a high school setting, a t-test is probably over-complicated. Hence, one has to simplify the method of comparison. This can be done by comparing uncertainty intervals (see equation (8) in Uncertainty). One rule of thumb is that: overlapping uncertainty intervals indicate compatible results.
Suppose two groups have measured the specific heat of two similar-looking metal objects. Group A has measured cA = (375 ± 12) J kg-1 K-1 and group B cB = (393 ± 10) J kg-1 K-1, see Fig. 9a. The groups now ask themselves, could these objects be made of the same metal, i.e., can the metal in the objects have the same specific heat? The uncertainty interval indicates the range in which the measurand can be expected. Hence, the overlapping in uncertainty intervals indicate a shared range of possible specific heat values that can be associated with both objects, see Fig. 9b. Thus, the results are compatible and they have to acknowledge the possibility that the specific heat of both objects is the same.
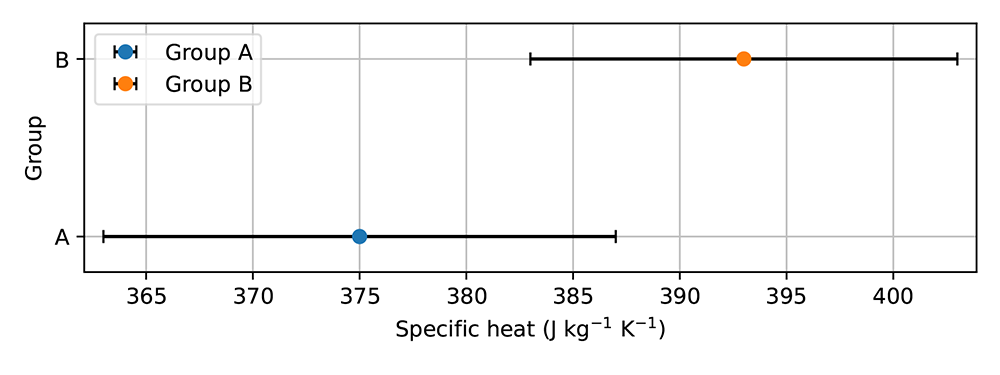
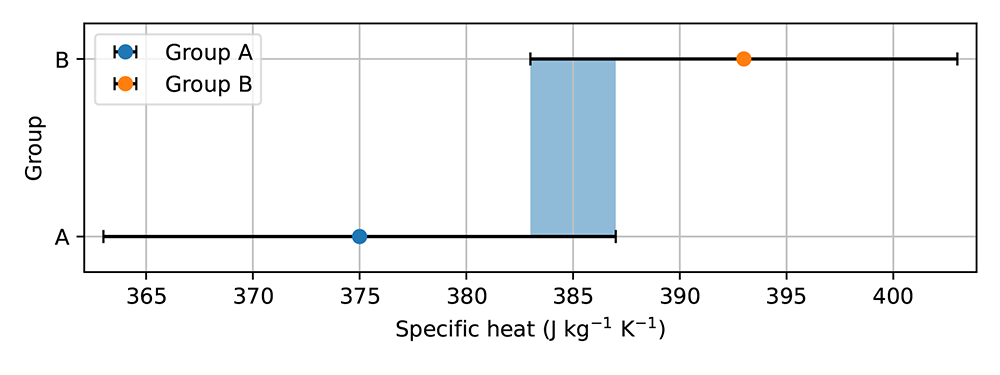
This does not mean that they have proven that the specific heat is the same! They have one piece of evidence that it could be the same. Depending on the degree of overlap and the range of the uncertainty interval, this possibility can be evaluated.
Students' ideas about data comparison []
When asked about the compatibility between a measurement result and a reference value, some students will refer to a (percentage) difference. Although this is an aspect of the quality of a result, it is not an indication of compatibility. This can be illustrated to students with the results in Tab. 6.
Table 6: Experimental results in determining the gravitational acceleration. Measurement result A, although having the smallest uncertainty, is not compatible with the reference value.
| Reference value: | |
| gRef | 9.81 m/s2 |
| Experimental results: | |
| gA | (9.83 ± 0.01) m/s2 |
| gB | (9.78 ± 0.05) m/s2 |
| gC | (9.83 ± 0.15) m/s2 |
Although groups A and C both have a difference of 0.02 m/s2 with the reference value, group A's result is not compatible with the reference value. Groups B and C both are compatible with the reference value. And, even though the difference with the reference value of group B is larger than that of group C, its uncertainty is three times smaller.
Further reading [ ]
]
For a didactical simplification of the t-test see: [1].
An online t-test calculator can be found here: https://www.graphpad.com/quickcalcs/ttest1.cfm.
Some more explanation about the statistics of the t-tests can be found on Wikipedia: https://en.wikipedia.org/wiki/Student's_t-test.
Literature
- Neumann, S. (2021). Bin ich wirklich schneller als mein Sitznachbar? Plus Lucis, 4, 36–38.